Installing
Contents
Installing
To use the Dask Operator you must install the custom resource definitions, service account, roles, and the operator controller deployment.
Quickstart
$ helm install --repo https://helm.dask.org --create-namespace -n dask-operator --generate-name dask-kubernetes-operator
Installing with Helm
The operator has a Helm chart which can be used to manage the installation of the operator. The chart is published in the Dask Helm repo repository, and can be installed via:
$ helm repo add dask https://helm.dask.org
"dask" has been added to your repositories

$ helm repo update
Hang tight while we grab the latest from your chart repositories...
...Successfully got an update from the "dask" chart repository
Update Complete. ⎈Happy Helming!⎈

$ helm install --create-namespace -n dask-operator --generate-name dask/dask-kubernetes-operator
NAME: dask-kubernetes-operator-1666875935
NAMESPACE: dask-operator
STATUS: deployed
REVISION: 1
TEST SUITE: None
NOTES:
Operator has been installed successfully.
Then you should be able to list your Dask clusters via kubectl.
$ kubectl get daskclusters
No resources found in default namespace.
We can also check the operator pod is running:
$ kubectl get pods -A -l app.kubernetes.io/name=dask-kubernetes-operator
NAMESPACE       NAME                                        READY   STATUS    RESTARTS   AGE
dask-operator   dask-kubernetes-operator-775b8bbbd5-zdrf7   1/1     Running   0          74s
Warning
Please note that Helm does not support updating or deleting CRDs. If updates are made to the CRD templates in future releases (to support future k8s releases, for example) you may have to manually update the CRDs or delete/reinstall the Dask Operator.
Single namespace
By default the controller is installed with a ClusterRole and watches all namespaces.
You can also just install it into a single namespace by setting the following options.
$ helm install -n my-namespace --generate-name dask/dask-kubernetes-operator --set rbac.cluster=false --set kopfArgs="{--namespace=my-namespace}"
NAME: dask-kubernetes-operator-1749875935
NAMESPACE: my-namespace
STATUS: deployed
REVISION: 1
TEST SUITE: None
NOTES:
Operator has been installed successfully.
Prometheus
The operator helm chart also contains some optional ServiceMonitor and PodMonitor resources to enable Prometheus scraping of Dask components. As not all clusters have the Prometheus operator installed these are disabled by default. You can enable them with the following comfig options.
metrics:
   scheduler:
      enabled: true
      serviceMonitor:
         enabled: true
   worker:
      enabled: true
      serviceMonitor:
         enabled: true
You’ll also need to ensure the container images you choose for your Dask components have the prometheus_client library installed.
If you’re using the official Dask images you can install this at runtime.
from dask_kubernetes.operator import KubeCluster
cluster = KubeCluster(name="monitored", env={"EXTRA_PIP_PACKAGES": "prometheus_client"})
Chart Configuration Reference
Dask-kubernetes-operator
A helm chart for managing the deployment of the dask kubernetes operator and CRDs
Configuration
The following table lists the configurable parameters of the Dask-kubernetes-operator chart and their default values.
Parameter |
Description |
Default |
|---|---|---|
|
Docker image for the operator |
|
|
Release version |
|
|
Pull policy |
|
|
Image pull secrets for private registries |
|
|
Override release name (not including random UUID) |
|
|
Override full release name |
|
|
Create a service account for the operator to use |
|
|
Annotations to add to the service account |
|
|
The name of the service account to use. If not set and create is true, a name is generated using the fullname template. |
|
|
Create a Role/ClusterRole needed by the operator and bind it to the service account |
|
|
Creates a ClusterRole if true, else create a namespaced Role |
|
|
Extra annotations for the operator pod |
|
|
Security context for the operator pod |
|
|
|
|
|
|
|
|
|
|
|
|
|
|
|
|
|
Resources for the operator pod |
|
|
Volumes for the operator pod |
|
|
Volume mounts for the operator container |
|
|
Node selector |
|
|
Tolerations |
|
|
Affinity |
|
|
Priority class |
|
|
Command line flags to pass to kopf on start up |
|
|
Enable scheduler metrics. Pip package [prometheus-client](https://pypi.org/project/prometheus-client/) should be present on scheduler. |
|
|
Enable scheduler servicemonitor. |
|
|
Deploy servicemonitor in different namespace, e.g. monitoring. |
|
|
Selector to select which namespaces the Endpoints objects are discovered from. |
|
|
Additional labels to add to the ServiceMonitor metadata. |
|
|
Interval at which metrics should be scraped. |
|
|
The label to use to retrieve the job name from. |
|
|
TargetLabels transfers labels on the Kubernetes Service onto the target. |
|
|
MetricRelabelConfigs to apply to samples before ingestion. |
|
|
Enable workers metrics. Pip package [prometheus-client](https://pypi.org/project/prometheus-client/) should be present on workers. |
|
|
Enable workers podmonitor |
|
|
Deploy podmonitor in different namespace, e.g. monitoring. |
|
|
Selector to select which namespaces the Endpoints objects are discovered from. |
|
|
Additional labels to add to the PodMonitor metadata. |
|
|
Interval at which metrics should be scraped. |
|
|
The label to use to retrieve the job name from. |
|
|
PodTargetLabels transfers labels on the Kubernetes Pod onto the target. |
|
|
MetricRelabelConfigs to apply to samples before ingestion. |
|
|
|
|
|
|
Documentation generated by Frigate.
Installing with Manifests
If you prefer to install the operator from static manifests with kubectl and set configuration options with tools like kustomize you can generate the default manifests with:
$ helm template --include-crds --repo https://helm.dask.org release dask-kubernetes-operator | kubectl apply -f -
Kubeflow
In order to use the Dask Operator with Kubeflow you need to perform some extra installation steps.
User permissions
Kubeflow doesn’t know anything about our Dask custom resource definitions so we need to update the kubeflow-kubernetes-edit cluster role. This role
allows users with cluster edit permissions to create pods, jobs and other resources and we need to add the Dask custom resources to that list. Edit the
existing clusterrole and add a new rule to the rules section for kubernetes.dask.org that allows all operations on all custom resources in our API namespace.
$ kubectl patch clusterrole kubeflow-kubernetes-edit --type="json" --patch '[{"op": "add", "path": "/rules/-", "value": {"apiGroups": ["kubernetes.dask.org"],"resources": ["*"],"verbs": ["*"]}}]'
clusterrole.rbac.authorization.k8s.io/kubeflow-kubernetes-edit patched
Dashboard access
If you are using the Jupyter Notebook service in KubeFlow there are a couple of extra steps you need to do to be able to access the Dask dashboard. The dashboard will be running on the scheduler pod and accessible via the scheduler service, so to access that your Jupyter container will need to have the jupyter-server-proxy extension installed. If you are using the Dask Jupter Lab extension this will be installed automatically for you.
By default the proxy will only allow proxying other services running on the same host as the Jupyter server, which means you can’t access the scheduler
running in another pod. So you need to set some extra config to tell the proxy which hosts to allow. Given that we can already execute arbitrary code
in Jupyter (and therefore interact with other services within the Kubernetes cluster) we can allow all hosts in the proxy settings with
c.ServerProxy.host_allowlist = lambda app, host: True.
The dask_kubernetes.operator.KubeCluster and distributed.Client objects both have a dashboard_link attribute that you can
view to find the URL of the dashboard, and this is also used in the widgets shown in Jupyter. The default link will not work on KubeFlow so you need
to change this to "{NB_PREFIX}/proxy/{host}:{port}/status" to ensure it uses the Jupyter proxy.
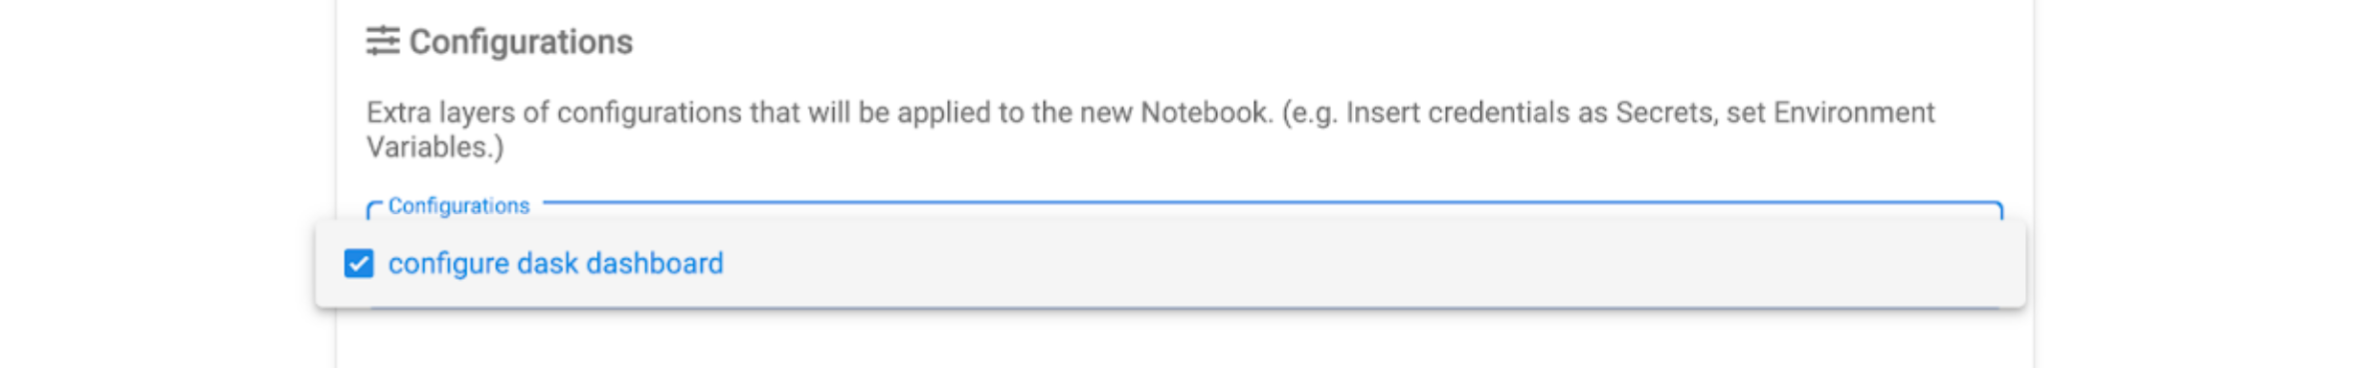
To apply these configuration options to the Jupyter pod you can create a PodDefault configuration object that can be selected when launching the notebook. Create
a new file with the following contents.
# configure-dask-dashboard.yaml
apiVersion: "kubeflow.org/v1alpha1"
kind: PodDefault
metadata:
name: configure-dask-dashboard
spec:
selector:
   matchLabels:
      configure-dask-dashboard: "true"
desc: "configure dask dashboard"
env:
   - name: DASK_DISTRIBUTED__DASHBOARD__LINK
      value: "{NB_PREFIX}/proxy/{host}:{port}/status"
volumeMounts:
   - name: jupyter-server-proxy-config
   mountPath: /root/.jupyter/jupyter_server_config.py
   subPath: jupyter_server_config.py
volumes:
   - name: jupyter-server-proxy-config
   configMap:
      name: jupyter-server-proxy-config
---
apiVersion: v1
kind: ConfigMap
metadata:
name: jupyter-server-proxy-config
data:
jupyter_server_config.py: |
   c.ServerProxy.host_allowlist = lambda app, host: True
Then apply this to your KubeFlow user’s namespace with kubectl. For example with the default user@example.com user
it would be.
$ kubectl apply -n kubeflow-user-example-com -f configure-dask-dashboard.yaml
Then when you launch your Jupyter Notebook server be sure to check the configure dask dashboard configuration option.